Earth’s climate is determined by the flow of energy coming in and out of the Earth-atmosphere system. When reaching the atmosphere, a fraction (about 30 per cent) of the incoming Sun’s radiation is directly reflected into space. The remaining part is absorbed by the atmosphere and Earth’s surface and reemitted as heat back into space. On its way to space, a fraction of this radiation is trapped by greenhouse gases, leading to an increase in atmospheric temperature. Without the greenhouse effect, the average temperature at Earth’s surface would only be about -18°C. At equilibrium, the incoming and outgoing radiation compensate each other on average.
Since the industrial era, human activities have led to the release of ever greater amounts of greenhouse gases—mostly carbon dioxide (CO2), methane (CH4) and nitrous oxide (N2O)—causing a perturbation of this balance by absorbing a larger fraction of Earth’s radiation. This translates into an increase in surface temperature (called climate feedback).
A correct evaluation of the fraction of Earth’s radiation reaching the top of the atmosphere—referred to as Earth’s outgoing longwave radiation (OLR)—and how the different greenhouse gases and feedbacks impact it is essential to improving our ability to model the Earth-atmosphere system and its long-term changes. Over the last four decades, considerable improvements have been achieved through numerous studies exploiting the measurements from dedicated broadband instruments (e.g. Trenberth et al., 2010; Dewitte & Clerbaux, 2018). However, such instruments only provide an integrated OLR over a broad spectral range which is not ideal for separately tracking the impact of the different parameters affecting the OLR and for identifying compensating biases and errors in climate models.
Retrieving the spectrally resolved OLR from space
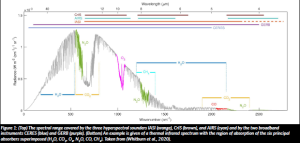
Better constraints can be obtained from spectrally resolved OLR (i.e. the integrand of broadband OLR; abbreviated SR-OLR hereafter) derived from hyperspectral sounders measuring the radiance in the thermal infrared spectral range with a higher spectral resolution. Indeed, when absorbing Earth’s radiation, the atmospheric gases leave a unique spectral signature (a sort of climate fingerprint) in the OLR (see Figure 1, bottom), which can be characterised.
Currently, several hyperspectral sounders in space acquire radiances in the thermal infrared region (see Figure 1, top). Until now, however, only limited interest was given to their measurements for the study of OLR.
In the framework of the IASI-FT project, I have developed an algorithm to derive the SR-OLR with a very high spectral sampling (0.25 cm-1) from the measurements of the Infrared Atmospheric Sounding Interferometer (IASI) instruments (Clerbaux et al., 2019; Hilton et al., 2012) onboard the Eumetsat Metop series of polar-orbiting satellites (Whitburn et al., 2020). This is the first retrieval algorithm that allows the SR-OLR to be derived with such a high spectral sampling, regardless of the satellite instrument.
Developed by the French Space Agency CNES, IASI is a sophisticated and versatile mission designed to fulfil the needs of three communities: numerical weather prediction, climate research and atmospheric composition monitoring.
IASI is a unique sounder in the satellite era, measuring ‘calibrated’ radiances in the thermal infrared spectral range at a global scale and revisiting all points on the Earth’s surface twice a day. The instrument has a very good horizontal coverage, providing more than 1.2 million (15 GB) radiance spectra per day with a footprint on the ground of 12 km diameter pixel (at nadir). IASI is a groundbreaking remote sensor, allowing near-realtime mapping of chemical species and meteorological variables, contributing to our understanding of atmospheric and climate processes. More than 13 years of data are now readily available, with three instruments currently orbiting Earth.
As previously mentioned, the fundamental quantity measured by satellite infrared sounders is the directional radiance. The approach I followed for deriving the SR-OLR from the IASI radiance spectra relies on angular distribution models (ADMs). These consist of a set of factors that allow correction for the anisotropy of the atmosphere. As the latter is highly influenced by the state of Earth’s surface and the atmosphere, the ADMs were calculated for more than 140,000 different scenes (all of them corresponding to a unique set of atmospheric and surface conditions) to reach a good precision. With this set of ADMs, the conversion of any IASI spectra to the corresponding SR-OLR is performed by simply applying the ADM associated with the closest scene to the directional radiance.
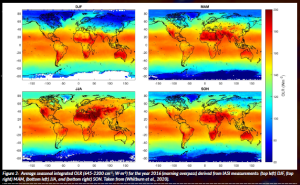
As an example, Figure 2 shows the mean seasonal OLR for the morning overpasses of IASI in 2016. For the representation, the SR-OLR was integrated over the spectral range between 645 and 2,300 cm-1. A clear seasonality can be observed, especially above land in the Northern Hemisphere. This variability reflects mostly the changes in surface temperature over the year, with lower (higher) values of OLR observed during the boreal winter months for the Northern (Southern) Hemisphere and vice versa for the summer months.
Deriving trends in the SR-OLR
The main interest of our OLR product lies in its spectrally resolved aspect. One particularly interesting application is the analysis of the trends in the SR-OLR. These allow precision evaluation of the impact of the changes in the greenhouse gas concentrations on the thermal flux and can also be used to study different major climate phenomena and detect their potential teleconnections around the globe.
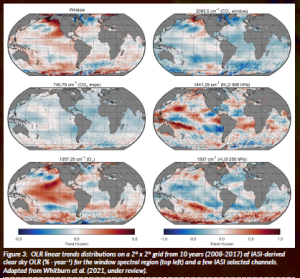
In a paper recently submitted to npj Climate and Atmospheric Science (Whitburn et al., 2021; under review), I have performed a trend analysis on our SR-OLR data set on the whole series of IASI channels between 645 and 2,300 cm-1 (6,621 channels in total). Figure 3 illustrates some maps of global trends distributions for a few of them. These reflect the changes in the concentrations of different greenhouse gases—CO2, water vapour (H2O) and ozone (O3)—and the temperature at different altitudes in the atmosphere. In the atmospheric window region (top left), the atmosphere is mostly transparent, and the changes in the OLR correspond principally to variations in the surface temperature. Here, because of the relatively short period considered for the analysis (2008—2017), the trends observed are mainly related to the activity of major climate processes—mostly the El Niño Southern Oscillation (ENSO) and the Pacific Decadal Oscillation (PDO) for which typical patterns can be identified above the Pacific Ocean.
In contrast, the effect of increasing atmospheric CO2 concentrations is clearly visible on the trend maps of two different CO2 sensitive channels (top right and middle left panels): as the rise of CO2 leads to an increase of the fraction of SR-OLR absorbed, the trends observed are negative. The trends in the ozone-sensitive channel reflect, for their part, the impact of the ENSO phenomena on the global tropospheric-stratospheric circulation known as Brewer-Dobson circulation (BDC). During an El Niño event, the BDC is strengthened, increasing the transport of air poor in O3 from the troposphere into the stratosphere. Conversely, at mid-latitudes, enhanced downward motions of air masses from the stratosphere to the troposphere lead to increased O3 concentrations. This translates into positive trends in the SROLR in the tropics (as less O3 results in less radiation absorbed) and the opposite at higher latitudes.
Finally, for the two H2O channels (middle and bottom-right panels) sensitive to different altitudes in the atmosphere, the trends reflect both the changes in atmospheric temperature and in H2O concentrations. In particular, main convergence and subsidence zones usually associated with large-scale atmospheric circulation (which carries heat and moisture) are clearly visible on the middle-right panel.
References
Clerbaux, C., Boynard, A., Clarisse, L., George, M., Hadji-Lazaro, J., Herbin, H., Hurtmans, D., Pommier, M., Razavi, A., Turquety, S., Wespes, C. and Coheur P.-F. (2009) ‘Monitoring of atm spheric composition using the thermal infrared IASI/MetOp sounder’, Atmospheric Chemistry and Physics, 9, pp.6041–6054. doi: 10.5194/acp-9-6041-2009.
Dewitte, S. and Clerbaux, N. (2018) ‘Decadal Changes of Earth’s Outgoing Longwave Radiation’, Remote Sensing, 10, p.1539. doi: 10.3390/rs10101539.
Hilton, F. et al. (2012) ‘Hyperspectral Earth Observation from IASI: Five Years of Accomplishments’, Bulletin of the American Meteorological Society, 93, pp. 347–370. doi: 10.1175/BAMS-D-11-00027.1.
Trenberth, K. E., Fasullo, J. T., O’Dell, C. and Wong, T. (2010) ‘Relationships between tropical sea surface temperature and top-of-atmosphere radiation’, Geophysical Research Letters, 37. doi: 10.1029/2009GL042314.
Whitburn, S., Clarisse, L., Bauduin, S., George, M., Hurtmans, D., Safieddine, S., Coheur, P.-F. and Clerbaux, C. (2020) ‘Spectrally resolved fluxes from IASI data: Retrieval algorithm for clear-sky measurements’, Journal of Climate, 33(16), pp.6971–6988. doi: 10.1175/JCLI-D-19-0523.1.
Whitburn, S. et al. 2021 (under review) ‘Trends in spectrally resolved OLR from 10 years of IASI measurements’, npj Climate and Atmospheric Science.
Image legends
Figure 1: (Top) The spectral range covered by the three hyperspectral sounders IASI (orange), CrIS (brown), and AIRS (cyan) and by the two broadband instruments CERES (blue) and GERB (purple). (Bottom) An example is given of a thermal infrared spectrum with the region of absorption of the six principal absorbers superimposed (H2O, CO2, O3, N2O, CO, CH4). Taken from (Whitburn et al., 2020).
Figure 2: Average seasonal integrated OLR (645-2300 cm-1; W∙m-2) for the year 2016 (morning overpass) derived from IASI measurements: (top left) DJF, (top right) MAM, (bottom left) JJA, and (bottom right) SON. Taken from (Whitburn et al., 2020).
Figure 3: OLR linear trends distributions on a 2° x 2° grid from 10 years (2008-2017) of IASI-derived clear sky OLR (% ∙ year -1) for the window spectral region (top left) and a few IASI selected channels. Adapted from Whitburn et al. (2021, under review).
Article summary
PROJECT SUMMARY
The ERC advanced “IASI-FT” project exploits the space-based instantaneous spectrally resolved observations provided by the family of IASI thermal infrared instruments to (1) monitor atmospheric composition changes and (2) establish climate records. More than 3.5 million of data are available each day, from which near-real-time information on the atmospheric state can be inferred.
PROJECT LEAD PROFILE
Simon Whitburn is a research scientist working at SQUARES (Université Libre de Bruxelles (ULB), Belgium). He made a PhD at ULB on the detection of ammonia emissions from vegetation fires using infrared satellite measurements (2017). Since then, he is focusing on the retrieval and the analysis of the changes in Earth’s outgoing longwave radiation.
PROJECT PARTNERS
The IASI-FT team resides in two locations. The LATMOS group is part of the Sorbonne University, downtown Paris. The SQUARES group is established at Université Libre de Bruxelles. This configuration has already led to numerous papers on atmospheric chemistry over the past 18 years, strong international collaborations, outreach actions/media interest, and sustainable distribution of data for societal purposes.
CONTACT DETAILS
Simon Whitburn
Spectroscopy, Quantum Chemistry and Atmospheric Remote Sensing (SQUARES) service, Université Libre de Bruxelles, 50 avenue F. D. Roosevelt, B-1050 Brussels, Belgium.
Email: simon.whitburn@ulb.be
Web: https://iasi-ft.eu/
FUNDING
This project has received funding from the European Union’s Horizon 2020 research and innovation programme under the advanced grant agreement no. 742909.


