Improve the quality of our climate projections for the future
Many of us are fascinated by the daily weather. After all, continuously changing weather patterns affect the majority of our activities and plans. Yet, although we are familiar with day-time weather phenomena, such as the appearance of fair-weather clouds, most of us have not have realised that ‘night-time’ weather can be just as fascinating and relevant.
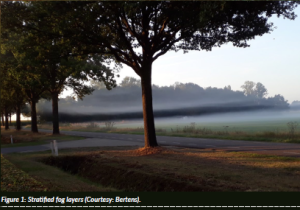
At night, the surface cools through thermal radiation. As the air becomes cold and dense, it is reluctant to move vertically. When winds are weak, turbulent mixing is strongly suppressed and air tends to ‘stick’ to the surface, as beautifully visualised when morning fog is present (Figure 1): the air is stratified in layers.
Cold and stably stratified boundary layers not only occur during night-time, but they also prevail in general arctic and winter conditions, where the impact of global warming is expected to be largest (Kerr, 2012).
Unfortunately, the description of turbulent mixing under those conditions is highly uncertain in present-generation weather and climate models (Baklanov et al., 2011). In particular, it is not clear under what conditions turbulence ‘gives up’, i.e. when the ambient wind is unable to sustain significant turbulence. Such situations favour the occurrence of cold extremes.
Due to our ignorance, differences between various plausible mixing schemes easily amount up to 5 to 10 K over cold regions, which makes accurate weather and climate prediction problematic (Holtslag et al., 2013). As such, this sudden ‘collapse of turbulence’ is at the heart of those forecast problems.
The aim of the ERC-consolidator project COAT is to understand the mechanism behind it.
The hypothesis: a positive feedback
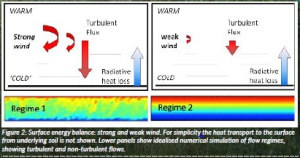
The physics at night can be understood as a competition between radiative surface cooling and turbulent heat transport, which tries to mix cold heavy air with warmer air aloft (Figure 2). Depending on the outcome, the atmosphere will remain in a turbulent state (regime 1) or will become quasi-laminar (regime 2). In cloudy/windy conditions it remains relatively warm and turbulent at night. Under clear skies and weak winds, however, turbulence may suddenly collapse. Vertical heat transport ceases, and the surface cools strongly.
Figure 2: Surface energy balance: strong and weak wind. For simplicity the heat transport to the surface from underlying soil is not shown. Lower panels show idealised numerical simulation of flow regimes, showing turbulent and nonturbulent flows.
How does this work? The key element is the vertical density gradient (temperature gradient) of the air. In windy conditions, the flow has sufficient kinetic energy, and mixing is strong. In that case, a stronger vertical temperature gradient results in increasing downward heat flux (large red arrow) to compensate surface cooling.
In weak wind conditions, however, the density stratification itself has an impact on vertical transport, which is now hampered. As a result, the downward heat flux decreases despite the increasing gradient (small red arrow). This intriguing aspect enables the following feedback to occur: -Skies are clear and wind is weak → reduced turbulent mixing → reduced downward heat transport → near-surface air cools → stronger density gradient → reduced turbulent mixing.
Due to this vicious circle, turbulence will eventually cease, and surface cooling will be very strong until it is stopped by other processes such as soil heat transport. This positive feedback is hypothesised to be responsible for the collapse of turbulence under weak wind conditions.
The main goal of the ERC-consolidator project COAT was to test this hypothesis by using a unique combination of approaches ranging from theoretical analysis and advanced numerical simulation of turbulent flows, to analysis of meteorological field data and simplified conceptual modelling.
In phase I the aforementioned idealised case without surface interaction (soil heat transport) was studied. From 3D turbulent flow simulations, it was proven that the feedback is indeed responsible for the collapse of turbulence. Moreover, theoretical analysis revealed that it could be predicted using ‘early warning signals’ in the flow, which hint at the presence of this positive feedback (Van Hooijdonk et al., 2017). Here, however, we focus on the most realistic and most interesting case when surface feedback plays a role.
Land surface as a cooling mediator?
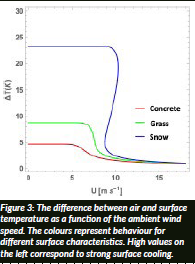
First, the complex reality was simplified to its essence by making a conceptual model (Van de Wiel et al., 2017). It includes a rudimentary description of the radiative cooling, the (nonlinear) turbulent heat transport and the heat transport from the ground (grass, concrete, snow). The main result is shown in Figure 3. It depicts the surface cooling with respect to the air above as a function of the wind speed in the lower atmosphere. High values on the vertical axes imply that the surface is very cold.
We start at the right side of the figure. For strong winds, surface cooling is weak as a consequence of the vigorous turbulent mixing, which results in large downward turbulent heat transport (as in Figure 2a). However, when we move to the left, the surface cooling suddenly increases. This point coincides with the collapse of turbulence. The critical wind speed where this occurs is referred to as the ‘minimum wind speed for sustainable turbulence’ (Van de Wiel et al., 2012). Finally, for lower winds the cooling reaches a plateau. At this point, turbulence has vanished and radiative cooling is fully compensated by conductive heat transport from the underlying surface.
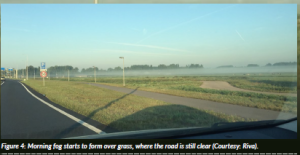
Interestingly, the ‘end state’ for zero wind is different for different surfaces. It ranges from modest cooling over concrete via medium cooling over grass and very high cooling over snow: snow surface temperatures can be over 20 degrees colder than the air aloft! We can understand this as follows. Snow and grass are insulators, acting like clothes. This prevents heat (stored during daytime) from being released during the night. A concrete surface, in contrast, is a better conductor. Therefore, more heat is stored and released, and the surface temperature remains warmer at night. This is visible in nature when fog occurs: it first forms over the coldest regions with meadows before it enters the roads (Figure 4). Also, the nocturnal urban heat island, e.g. as discussed in Safieddine (2021)—can partly be explained by those different heat conductive characteristics between urban and rural surfaces.
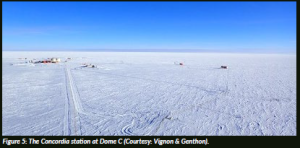
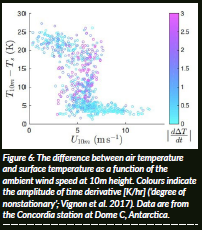
The typical S-shape behaviour predicted by this rudimentary model was also found in observations over grass surfaces in the Netherlands. But perhaps the most interesting case is expected over (fresh) snow, which is an excellent insulator because of its ‘open’ structure with air pockets. To investigate behaviour over snow, data from the Antarctic weather station ‘Concordia’ at Dome C were analysed (Vignon et al., 2017; Figure 5). Results are depicted in Figure 6.
The data show a striking resemblance with the ‘predictions’ by the conceptual model. Not only the characteristic S-Shape is found, but also the ‘back folding’ seems to be present.
Nevertheless, it is emphasised that the conceptual model is still a crude simplification of reality. To assess generality, additional simulations and data analysis from weather forecast models and general circulation models were done (e.g. Baas et al., 2019; Vignon et al., 2018). Those models with more complete process descriptions showed similar S-shape dependencies, with a sharp wind speed transition zone between ‘warm’ and ‘cold’ states of surface temperature. As such, it appears that the essence of the phenomenon is captured and that the positive feedback is indeed responsible for this collapse.
Practical implications: what’s next?
From the findings of the COAT project, we now better understand why and when the collapse of atmospheric turbulence occurs and the impact of the underlying surface. This enables better prediction of ‘coldweather’ phenomena such as road frost and fog formation, and it helps to understand why the occurrence hereof is so strongly connected with land-surface characteristics (see, e.g. Izett et al., 2019). This facilitates the development of ‘early warning systems’ for those hazardous phenomena.
From a large-scale perspective, the experimental data for rapid regime transitions found over cold regions has the potential to serve as kind of critical ‘litmus test’ for the next generation of climate models. This can ultimately help to improve the quality of our climate projections for the future.
References
Baas, P., van de Wiel, B.J.H, van Maijgaard, E., Vignon, E., Genthon, C., van der Linden, S.J.A. and de Roode, S.R. (2019) ‘Transitions in the wintertime near‐surface temperature inversion at Dome C, Antarctica’, Quarterly Journal of the Royal Meteorological Society, 145(720), pp. 930–946. doi: 10.1002/ qj.3450.
Baklanov, A.A., Grisogono, B., Bornstein, R., Mahrt, L., Zilitinkevich, S.S., Taylor, P., Larsen, S.O., Rotach, M.W. and Fernando, H.J.S. (2011) ‘The Nature, Theory, and Modeling of Atmospheric Planetary Boundary Layers’, Bulleting of the American Meteorological Society, 92(2), pp. 123–128. doi: 10.1175/2010BAMS2797.1.
Holtslag, A., Svensson, G., Baas, P., Basu, S., Beare, B., Beljaars, A., Bosveld, F., Cuxart, J., Lindvall, J., Steeneveld, G., Tjernström, M. and Van De Wiel, B. (2013) ‘Stable Atmospheric Boundary Layers and Diurnal Cycles: Challenges for Weather and Climate Models’, Bulletin of the American Meteorological Society, 94(11). pp. 1691–1706. doi: 10.1175/BAMS-D-11-00187.1.
Izett, J., Wiel, B., Baas, P., Hooft, J. and Schulte, R. (2019) ‘Dutch fog: On the observed spatio‐temporal variability of fog in the Netherlands’, Quarterly Journal of the Royal Meteorological Society, 145(723), pp. 2817–2834. doi: 10.1002/qj.3597.
Kerr, R. (2012) ‘Ice-Free Arctic Sea May Be Years, Not Decades, Away’, Science, 337(6102), pp. 1591– 1591. doi: 10.1126/science.337.6102.1591.
Safieddine, S. (2021) ‘What Can We Learn From Earth’s “Skin” Temperature’, Project Repository Journal, 8(January), pp. 88–91.
Van de Wiel, B., Moene, A., Jonker, H., Baas, P., Basu, S., Donda, J., Sun, J. and Holtslag, A. (2012) ‘The Minimum Wind Speed for Sustainable Turbulence in the Nocturnal Boundary Layer’, Journal of the Atmospheric Sciences, 69(11), pp. 3116-3127. doi: 10.1175/JAS-D-12-0107.1.
Van de Wiel, B., Vignon, E., Baas, P., van Hooijdonk, I., van der Linden, S., Antoon van Hooft, J., Bosveld, F., de Roode, S., Moene, A. and Genthon, C. (2017) ‘Regime Transitions in Near-Surface Temperature Inversions: A Conceptual Model’, Journal of the Atmospheric Sciences, 74(4), pp. 1057–1073. doi: 10.1175/JAS-D-16-0180.1.
Van Hooijdonk, I., Moene, A., Scheffer, M., Clercx, H. and van de Wiel, B. (2016) ‘Early Warning Signals for Regime Transition in the Stable Boundary Layer: A Model Study’, Boundary-Layer Meteorology, 162(2), pp. 283–306. doi: 10.1007/s10546-016-0199-9.
Vignon, E., van de Wiel, B., van Hooijdonk, I., Genthon, C., van der Linden, S., van Hooft, J., Baas, P., Maurel, W., Traullé, O. and Casasanta, G. (2017) ‘Stable boundary‐layer regimes at Dome C, Antarctica: observation and analysis’, Quarterly Journal of the Royal Meteorological Society, 143(704), pp. 1241– 1253. doi: 10.1002/qj.2998
Figure legends
Figure 1: Stratified fog layers (Courtesy: Bertens).
Figure 2: Surface energy balance: strong and weak wind. For simplicity the heat transport to the surface from underlying soil is not shown. Lower panels show idealised numerical simulation of flow regimes, showing turbulent and non-turbulent flows.
Figure 3: The difference between air and surface temperature as a function of the ambient wind speed. The colours represent behaviour for different surface characteristics. High values on the left correspond to strong surface cooling.
Figure 4: Morning fog starts to form over grass, where the road is still clear (Courtesy: Riva).
Figure 5: The Concordia station at Dome C (Courtesy: Vignon & Genthon).
Figure 6: The difference between air temperature and surface temperature as a function of the ambient wind speed at 10m height. Colours indicate the amplitude of time derivative [K/hr] (‘degree of nonstationary’; Vignon et al. 2017). Data are from the Concordia station at Dome C, Antarctica.
Article summary
PROJECT NAME
COAT: COLLAPSE OF ATMOSPHERIC TURBULENCE
PROJECT SUMMARY
The COAT project aims to predict the cessation of continuous turbulence in the evening boundary layer. The interaction between the lower atmosphere and the surface is studied in detail, as this plays a crucial role in the dynamics. Present generation forecasting models are incapable of predicting whether or not turbulence will survive or collapse under cold conditions. In nature, both situations frequently occur and lead to completely different temperature signatures. As such, significant forecast errors are made, particularly in arctic regions and winter conditions. Therefore, prediction of turbulence collapse is highly relevant for weather and climate prediction.
PROJECT LEAD
Bas van de Wiel is Antoni van Leeuwenhoekprofessor in Atmospheric Physics at the department of Geoscience and Remote Sensing, Faculty of Civil Engineering. In 2015 he joined GRS starting an ERC-Consolidator project after having fulfilled positions at Wageningen University (-2010) and Eindhoven Technical University (with nwo- VIDI; 2010-2015). He has a broad interest in environmental fluid mechanics and atmospheric physics, being particularly fascinated by physical transport phenomena in turbulent, stratified flows.
CONTACT DETAILS
Prof. Bas van de Wiel
Faculty of Civil Engineering and Geosciences, Building 23, Stevinweg 1 / PO box 5048 2628 CN Delft / 2600 GA Delft
Tel: +31 15 27 89526
Email: b.j.h.vandewiel@tudelft.nl
FUNDING
This project has received funding from the European Research Council (ERC) under the European Union’s Horizon 2020 research and innovation programme under grant agreement No. 648666.


