The ocean surface is a familiar place—waves breaking on the beach, boats heaving to and fro, a reflecting sunset. But beneath this surface layer lies one of the planet’s most mysterious and elusive realms: the ocean deep. Considering the ocean covers 70% of Earth, this leaves an awful lot of our planet that we simply don’t understand.
As an ocean physicist, I study how water moves deep below the surface. This topic is the focus of a new project called Capturing Oceanic Submesoscales, Stirring and Mixing with Sound and Simulations (COSSMoSS), which will combine novel observations and computer models to study sub-surface ocean flows in unprecedented detail. Because abyssal ocean currents mediate the Earth’s climate and biosphere, a better understanding of this hidden world is crucial for predicting the future trajectory of our planet and achieving a more sustainable and equitable home.
Mysteries of the interior ocean
“What we know is a drop, what we don’t know is an ocean.”
Attributed to Sir Isaac Newton
The ocean is vital to life. It regulates weather and climate, produces oxygen, supports rich biodiversity and provides vital food and mineral resources. The ocean system itself is underpinned by a complex flow of water masses that mix, transport and store precious cargo such as heat, salt, carbon, oxygen and nutrients.
However, interior ocean flows that are smaller than 10 km laterally and 1 km vertically, and that change over hours to days, are extremely hard to observe and remain poorly understood: these scale flows are known as ‘submesoscale’ currents (McWilliams, 2019).
So, how do we measure the ocean interior? Some of the first scientific measurements of the ocean were conducted during the pioneering Challenger expedition (1872–1876). Seabed sediments, water samples, ocean depth records and marine life specimens were collected for the first time from across the globe (Woolf, 2022). Artists and photographers worked alongside scientists to document the findings, which were compiled into extensive volumes. Life onboard the HMS Challenger must have been arduous but revolutionary: over 4000 new species were discovered, and the first steps towards understanding the shape of the ocean floor and ocean circulation were made. Today, whilst research vessels remain core, oceanography has been transformed by autonomous robotics, moored instruments, satellites and computer models that simulate ocean processes in more detail than observationally possible. Despite this progress, the complexity of the interior ocean still eludes us. That’s where COSSMoSS comes in: using sound pulses and cutting-edge simulations, we are capturing the ocean’s interior in more detail than ever before.
Seismic oceanography: using acoustics to reveal the ocean’s interior
The ocean is generally warmest at the surface, becoming increasingly cool with depth. However, ocean temperatures don’t always change smoothly. In many regions, the ocean is layered like a cake, or ‘stratified’, with distinct temperature and salinity zones. These layers can become distorted and stirred by currents, especially where the seafloor is rugged. For example, deep-sea slopes, canyons and ridges can generate spinning eddies and internal waves.
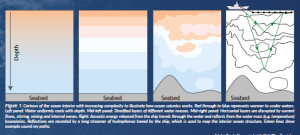
To capture the details of these underwater structures, COSSMoSS is using a technique known as seismic oceanography (Ruddick et al., 2009). See Figure 1. Low-frequency sound pulses (~100 Hz) are generated by the ship a few metres below the ocean surface. Some of this sound energy is reflected by boundaries between different water layers (i.e. changes in temperature and/or salinity). A several-km-long hydrophone streamer towed behind the ship records these echoes: changes as small as 0.01°C and 0.01 psu salinity units over a few metres can be detected. As the ship moves, it maps vertical slices of ocean structure from surface to seabed, and a 100 km section can be scanned in a matter of hours. The data has a resolution of about 10 metres both vertically and horizontally, which is an order of magnitude better than other observational methods. When combined with other measurements, these acoustic ocean maps allow scientists to quantify as yet unresolved flows and structures (e.g. Dickinson et al., 2019; Xiao et al., 2021).
An example from the COSSMoSS campaign (see Figure 2) shows that the ocean interior is anything but uniform: seismic oceanography is providing a new lens, bringing the detail of deep-ocean processes into focus.
The COSSMoSS experiment study region: the Brazil-Malvinas Confluence
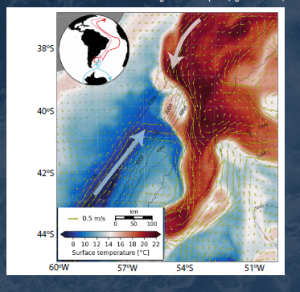
Our study site is the Brazil-Malvinas Confluence (BMC) in the Southwest Atlantic. Here, the warm, salty Brazil Current from the north meets the cool, fresh Malvinas Current from the south. See Figures 3 and 4. The BMC is the perfect location for COSSMoSS for several reasons:
- Rich in submesoscale activity: The interaction of energetic currents and complex seafloor topography promotes the formation of the small, fast-changing flows that we are interested in (Mason et al., 2017; Orúe-Echevarría et al., 2021; Roget et al., 2023).
- Ideal for acoustic sensing: BMC water properties support strong sound-based signals critical to the COSSMoSS method (Gunn et al., 2020).
- Global climate relevance: The BMC mediates the Atlantic Meridional Overturning Circulation, heat and salt transport into the Southern Ocean, and global carbon uptake (e.g. Pahnke et al., 2008; Guerrero et al., 2014; Piola and Matano, 2017).
- Ecosystem importance: The region sustains important fisheries, and submesoscale dynamics influence productivity by shaping nutrient and chlorophyll distributions (Machado et al., 2013).
- Understudied region: Despite its significance, the BMC is under-sampled and not well represented in models.
COSSMoSS in action: progress so far
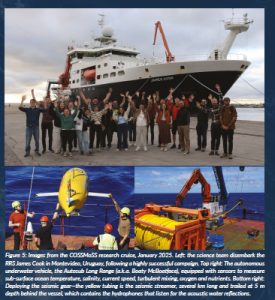
On 1 January 2025, the COSSMoSS team set sail from Montevideo, Uruguay, aboard the RRS James Cook to begin the project’s observational campaign (Figure 5). There was a shared sense of excitement, knowing many discoveries awaited. Over the next month, the ship served as both a home and a floating laboratory, allowing us to explore the dynamics of the BMC. The expedition successfully gathered high-resolution physical, chemical, geological and biological measurements. Alongside the central seismic acoustic experiment, an autonomous underwater vehicle and moored instruments collected complementary data. Argentine collaborators released 24 surface drifters to map surface currents, and marine mammals were monitored visually and acoustically to ensure minimal environmental impact. The data has unveiled a highly dynamic underwater world that we are now analysing in detail (Figure 2).
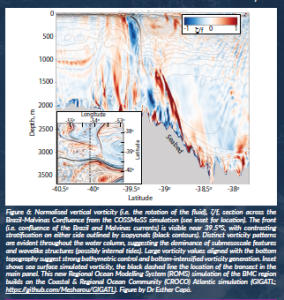
In parallel, a detailed numerical model of the BMC is being developed by Dr Esther Capó and Prof. James C. McWilliams. With 650 m horizontal resolution and 200 terrain following vertical layers, the model offers an unparalleled level of detail (Figure 6). The simulations will enable us to explore how the seafloor shape influences water movements and how submesoscale flows form, evolve and impact property distributions. Comparison with field data will provide important validation. A complementary modelling effort, led by Prof. Zhijin Li and PhD student Yikai Xu, is directly assimilating COSSMoSS acoustic data into simulations to further enhance model fidelity.
Conclusion
Together, the unique observations and modelling in COSSMoSS are painting a vivid new picture of the ocean’s interior, in all its extraordinary detail. These efforts will not only contribute to regional knowledge of ocean circulation and marine ecosystems but ultimately support the global climate modelling community. By better resolving submesoscale flows and understanding their role in transporting heat, carbon and nutrients, COSSMoSS contributes a critical missing piece to the climate puzzle.
We are just beginning to unlock the secrets of deep-ocean physics.
Watch this space.
References
Dickinson, A., White, N.J. and Caulfield, C.P. (2017) ‘Spatial variation of diapycnal diffusivity estimated from imaging of internal wave field, Gulf of Mexico’, Journal of Geophysical Research: Oceans, 122, pp. 9827–9854. doi: 10.1002/2017JC013352.
Guerrero, R.A., Piola, A.R., Fenco, H., Matano, R.P., Combes, V., Chao, Y., James, C., Palma, E.D., Saraceno, M. and Strub, P.T. (2014) ‘The salinity signature of the cross-shelf exchanges in the Southwestern Atlantic Ocean: Satellite observations’, Journal of Geophysical Research: Oceans, 119, pp. 7794–7810. doi: 10.1002/2014JC010113.
Gunn, K.L., White, N. and Caulfield, C.P. (2020) ‘Time-lapse seismic imaging of oceanic fronts and transient lenses within South Atlantic Ocean’, Journal of Geophysical Research: Oceans, 125, e2020JC016293. doi: 10.1029/2020JC016293.
Machado, I., Barreiro, M. and Calliari, D. (2013) ‘Variability of chlorophyll-a in the Southwestern Atlantic from satellite images: seasonal cycle and ENSO influences’, Continental Shelf Research, 53, pp. 102–109. doi: 10.1016/j.csr.2012.11.014.
Mason, E., Pascual, A., Gaube, P., Ruiz, S., Pelegrí, J.L. and Delepoulle, A. (2017) ‘Subregional characterization of mesoscale eddies across the Brazil-Malvinas Confluence’, Journal of Geophysical Research: Oceans, 122, pp. 3329–3357. doi: 10.1002/2016JC012611.
McWilliams, J.C. (2019) ‘A survey of submesoscale currents’, Geoscience Letters, 6(3). doi: 10.1186/s40562-019-0133-3.
Orúe-Echevarría, D., Pelegrí, J.L., Alonso-González, I.J., Benítez-Barrios, V.M., Emelianov, M., García-Olivares, A., Gasser i Rubinat, M., De La Fuente, P., Herrero, C., Isern-Fontanet, J., Masdeu-Navarro, M., Peña-Izquierdo, J., Piola, A.R., Ramírez-Garrido, S., Rosell-Fieschi, M., Salvador, J., Saraceno, M., Valla, D., Vallès-Casanova, I. and Vidal, M. (2021) ‘A view of the Brazil-Malvinas confluence, March 2015’, Deep Sea Research Part I: Oceanographic Research Papers, 172, 103533. doi: 10.1016/j.dsr.2021.103533.
Pahnke, K., Goldstein, S. and Hemming, S. (2008) ‘Abrupt changes in Antarctic Intermediate Water circulation over the past 25,000 years’, Nature Geoscience, 1, pp. 870–874. doi: 10.1038/ngeo360.
Piola, A.R. and Matano, R.P. (2017) ‘Ocean currents: Atlantic western boundary—Brazil Current/Falkland (Malvinas) Current’, in Cochran, J.K., Bokuniewicz, H.J. and Yager, P.L. (eds.) Encyclopedia of Ocean Sciences. 3rd edn. Elsevier, pp. 414–420. doi: 10.1016/B978-0-12-409548-9.10541-X.
Roget, E., Pelegrí, J.L., Planella-Morato, J., Puigdefàbregas, J., Emelianov, M., Vallès-Casanova, I. and Orúe-Echevarría, D. (2023) ‘Diapycnal mixing in the Brazil-Malvinas confluence front’, Progress in Oceanography, 211, 102968. doi: 10.1016/j.pocean.2023.102968.
Ruddick, B., Song, H., Dong, C. and Pinheiro, L. (2009) ‘Water column seismic images as maps of temperature gradient’, Oceanography, 22, pp. 192–205. doi: 10.5670/oceanog.2009.19.
Sheen, K.L. (2022) Capturing oceanic submesoscales, stirring, and mixing with sound and simulations. HORIZON ERC Consolidator Grant, unpublished proposal. University of Exeter, UK.
Woolf, J. (2022) ‘The Challenger Expedition: peering into the abyss’, The Royal Scottish Geographical Society, 16 December. Available at: https://www.rsgs.org/blog/the-challenger-expedition-peering-into-the-abyss (Accessed: 22 September 2025).
Xiao, W., Sheen, K. L., Tang, Q., Shutler, J., Hobbs, R. and Ehmen, T. (2021) ‘Temperature and salinity inverted for a Mediterranean eddy captured with seismic data, Using a spatially iterative Markov Chain Monte Carlo approach’, Frontiers in Marine Science, 8. doi: 10.3389/fmars.2021.734125.
Project summary
This topic is the focus of a new project called Capturing Oceanic Submesoscales, Stirring and Mixing with Sound and Simulations (COSSMoSS).
COSSMoSS aims to capture yet unresolved ocean flows using observations from sound reflections, alongside new model simulations. The project is based in the Brazil-Malvinas Confluence, a key region of inter-ocean-basin exchange in the SW Atlantic. COSSMoSS hopes to improve our understanding of how the ocean distributes heat, salt, oxygen, carbon and nutrients, key for mediating climate and sustaining life.
Project partners and core team
- Jim Mc Williams & Dr Esther Maria Capó Truyols, University of California, Los Angeles, US
- Dr Pauline Tedesco, Dr Yao Meng, Dr Dan Wilson, Dr Jennifer Watts, Linghan Meng, Matthew Mason, Jack Paton & Luisa Sulzberger, University of Exeter, UK
- Johnathan Gula & Vincent Mokuenko, Université de Bretagne Occidentale, France
- Zhijin Li & Yikai Xu, Fudan University, China. Prof. Martin Saraceno and Candela Lopez Fidel, Universidad de Buenos Aires, Argentina
- Alberto Naveria Garabato, Dr Emma Gregory & Dr Jingxuan Wei, University of Southampton, UK Prof. Richard Hobbs, Durham University, UK
- Dr Tobias Ehmen, Bjerknes Centre for Climate Research Dr Andea Rochner, Met Office, UK
- Dr Carla Berghoff, Instituto Nacional de Investigacion y Desarrollo Pesquero, Argentina
- Agustina Macchi, IIMyC-CONICET, Argentina
- Dr Federico Heredia, CESIMAR-CENPAT, CONICET, Argentina
Project lead profile
Katy is an Associate Professor in physical oceanography at the University of Exeter, UK and UKRI Future Leaders Fellow. She completed her BSc/MSc/PhD at the University of Cambridge and held research posts at the University of Southampton and Met Office Hadley Centre, UK. Katy has secured over £4.3 million in grants and supervised several PhD students and postdoctoral researchers.
Project contacts
Dr Katy Sheen
University of Exeter, Trelevier Road, Penryn, Cornwall, UK TR10 9FE.
Email: k.l.sheen@exeter.ac.uk
Web: https://experts.exeter.ac.uk/25588-katy-sheen
Web: https://profiles.flfdevnet.com/profile/k-l-sheenexeter-ac-uk/
Funding
This project has been funded by the UK Research & Innovation programme. Grant agreement No. MR/X035611/1
Figure legends
Figure 1: Cartoon of the ocean interior with increasing complexity to illustrate how ocean seismics works. Red through to blue represents warmer to cooler waters. Left panel: Water uniformly cools with depth. Mid-left panel: Stratified layers of different water masses. Mid-right panel: Horizontal layers are disrupted by current flows, stirring, mixing and internal waves. Right: Acoustic energy released from the ship travels through the water and reflects from the water mass (e.g. temperature) boundaries. Reflections are recorded by a long streamer of hydrophones towed by the ship, which is used to map the interior ocean structure. Green lines show example sound ray paths.
Figure 2: Acoustics (seismics) collected in January 2025 on the COSSMoSS field campaign reveal the detailed interior oceanic structure of the Brazil Current. Black/white stripes are sound reflection positive/negative amplitudes, which track temperature/salinity gradients (see Figure 1). Transect runs off the coast of Uruguay, northwest (NW, ~35.75 oS, ~52.85 oW), to southeast (SE, ~36.10 oS, ~52.37 oW). Only initial processing (i.e. brute stack with some noise attenuation) has been performed: future work will improve image clarity and convert reflections to temperature, salinity and vertical mixing. Figure by Dr Tobias Ehmen and Dr Jingxuan Wei.
Figure 3: Sea-surface temperatures on 30 May 2020 show the warm Brazil current (pink arrow) meeting the cold Malvinas current (blue arrow). Black contours = bathymetry; yellow arrows = surface current flow. Data from GEBCO 2021 bathymetry grid and Global Ocean Physics re-analysis products (https://doi.org/10.48670/moi-00021). Location is shown by the red box in the world map inset, which highlights the role of the BMC in connecting the northern and southern hemisphere currents: Pink/red = N. Atlantic overturning; Blue = Antarctic Circumpolar Current. Figure by Dr Tobias Ehmen and adapted from Sheen (2022).
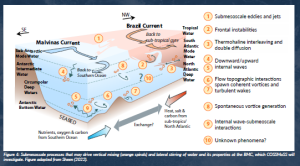
Figure 4: Submesoscale processes that may drive vertical mixing (orange spirals) and lateral stirring of water and its properties at the BMC, which COSSMoSS will investigate. Figure adapted from Sheen (2022).
Figure 5: Images from the COSSMoSS research cruise, January 2025. Left: the science team disembark the RRS James Cook in Montevideo, Uruguay, following a highly successful campaign. Top right: The autonomous underwater vehicle, the Autosub Long Range (a.k.a. Boaty McBoatface), equipped with sensors to measure sub-surface ocean temperature, salinity, current speed, turbulent mixing, oxygen and nutrients. Bottom right: Deploying the seismic gear—the yellow tubing is the seismic streamer, several km long and trailed at 5 m depth behind the vessel, which contains the hydrophones that listen for the acoustic water reflections.
Figure 6: Normalised vertical vorticity (i.e. the rotation of the fluid), ζ/f, section across the Brazil-Malvinas Confluence from the COSSMoSS simulation (see inset for location). The front (i.e. confluence of the Brazil and Malvinas currents) is visible near 39.5°S, with contrasting stratification on either side outlined by isopycnals (black contours). Distinct vorticity patterns are evident throughout the water column, suggesting the dominance of submesoscale features and wavelike structures (possibly internal tides). Large vorticity values aligned with the bottom topography suggest strong bathymetric control and bottom-intensified vorticity generation. Inset shows sea surface simulated vorticity, the black dashed line the location of the transect in the main panel. This new Regional Ocean Modelling System (ROMS) simulation of the BMC region builds on the Coastal & Regional Ocean Community (CROCO) Atlantic simulation (GIGATL; https://github.com/Mesharou/GIGATL). Figure by Dr Esther Capó.